Sources: SAPVIA ·
Moneyweb / NTCSA Sep 2025 ·
PV Magazine Feb 2026 ·
Energize Jan 2025 ·
CSIR
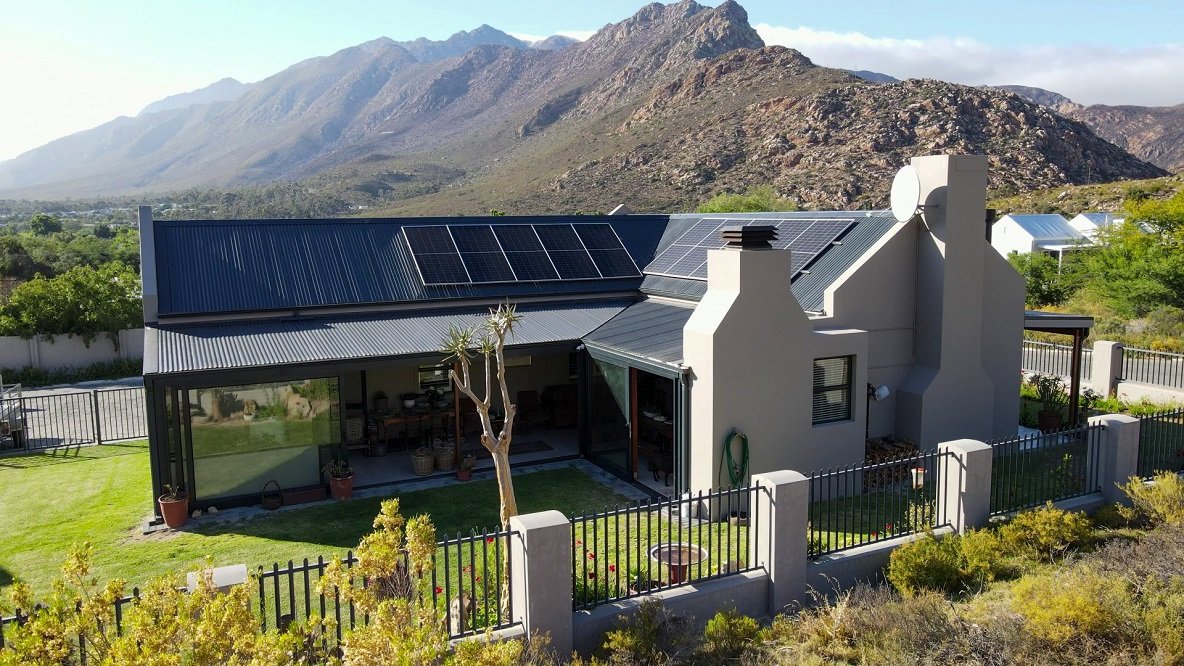
Load-shedding did something remarkable. It forced more than a million South African households to become energy producers. Between 2022 and 2025, the country experienced one of the fastest residential solar adoption rates anywhere on earth — and the infrastructure built during those peak load-shedding years has permanently changed South Africa’s energy landscape, whether load-shedding returns or not.
This guide synthesises data from the South African Photovoltaic Industry Association (SAPVIA), the National Transmission Company of South Africa (NTCSA), the CSIR Energy Centre, and multiple independent analyses into the clearest picture available of South Africa’s rooftop solar statistics — where it is installed, how much is there, what it costs, and where it is heading.
The Scale of the Revolution: From 2,264 MW to 7,300 MW in Three Years
When Eskom first published estimates of private rooftop solar capacity in August 2022, the figure stood at approximately 2,264 MW. By October 2024, SAPVIA reported the figure had grown to 6,165 MW. By September 2025, the National Transmission Company of South Africa (NTCSA) published data placing the total at 7,300 MW — a 215% increase from the August 2022 baseline in just over three years.
To contextualise 7,300 MW: this private solar capacity now exceeds the total capacity of all of Eskom’s Independent Power Producer (IPP) contracts, according to the Moneyweb September 2025 analysis. South Africa’s citizens and businesses have, without any centrally coordinated programme, built an energy generation infrastructure equal in scale to the country’s entire IPP fleet.
By the end of 2025, PV Magazine reported that South Africa added 1.6 GW of new solar capacity during 2025 — up from 1.1 GW in 2024, but below the record 2.6 GW added in 2023. Total cumulative solar capacity across all segments (residential, C&I, and utility-scale) exceeded 10 GW by mid-2025, according to SAPVIA, confirming South Africa’s position as Africa’s largest solar market.
How is the 1 million households figure calculated?
The NTCSA data of 7,300 MW covers all private solar — both residential and commercial/industrial (C&I). The data cannot distinguish between residential rooftops and commercial installations. However, based on a typical residential system size of 5–10 kW and the share of residential installations in SAPVIA’s GreenCard data, energy analysts broadly estimate that over 1 million residential installations have occurred, contributing approximately 1.5 GW of the total. The majority of the 7.3 GW total is now driven by commercial properties, which have accelerated adoption significantly even as residential growth moderated after the end of load-shedding in May 2024.
Where Is It Installed? The Provincial Breakdown
The NTCSA data, published from 2022 onwards, provides a provincial breakdown of private solar capacity. The distribution is heavily skewed toward South Africa’s three most urbanised, highest-income provinces — which reflects both the economic capacity required for system installation and the higher concentration of commercial properties driving large-scale C&I installations.
Private Solar PV by Province — September 2025
Sources: Moneyweb / NTCSA September 2025
~30% of total | ~2,190 MW
Largest single province by volume. High commercial density in Sandton, Midrand, and Johannesburg CBD drives large C&I installations alongside dense residential uptake.
~17% | ~1,240 MW
Now larger than Western Cape in installed capacity — 75% bigger according to NTCSA data. Strong commercial and agricultural sector adoption alongside residential growth in Durban metro.
~13% | ~950 MW
High early adopter rate in Cape Town metro. Western Cape’s proactive energy policy and municipal electricity environment (City Power vs Cape Town Metro) created favourable early conditions for residential solar.
~60% of total capacity
~8% | ~585 MW
~8% | ~585 MW
~24% | ~1,750 MW
Provincial MW estimates are calculated from NTCSA’s reported percentage shares of the 7,300 MW September 2025 total. Exact provincial figures are published at sapvia.co.za.
⚡ The KwaZulu-Natal Surprise
One of the more counterintuitive findings in the NTCSA provincial data: KwaZulu-Natal now has a significantly larger installed base than the Western Cape — approximately 75% more. This is driven primarily by commercial and agricultural adoption in KZN, particularly sugarcane farming operations, large commercial properties in Durban, and industrial facilities that have aggressively adopted solar for cost management.
The Load-Shedding Driver — and What Happened After It Ended
2023 was the extraordinary year. With South Africa experiencing some of the worst load-shedding in its history — including sustained Stage 6 periods — residential solar adoption surged to an estimated 2.6 GW installed in a single calendar year, the highest annual figure ever recorded. GoSolr CEO Andrew Middleton described 2023 as the residential solar boom year, adding that 2024 — while still strong — saw a marked slowdown as load-shedding eased and eventually ended.
Load-shedding intensifying. Adoption accelerating but NERSA registration backlog creates data lag. Private capacity base begins its rapid climb.
Record year. Sustained Stage 6 load-shedding. Feb 2023 government solar rebate (25% of panel cost). Residential boom drives 2.6 GW in a single year.
Load-shedding ends 15 May 2024. Residential demand drops 60–80% vs 2023. C&I adoption offsets residential slowdown. Still “second best year” per GoSolr.
C&I adoption accelerates driven by Eskom’s 12.74% April 2025 tariff increase. 928 MW deployed in Q1 2025 alone. Full year total 1.6 GW — above 2024.
The end of load-shedding on 15 May 2024 — after the last significant event on that date — sharply reduced the urgency driver for residential installations. SAPVIA noted that project volumes in the residential market declined 60–80% compared to 2023. However, the commercial and industrial (C&I) sector accelerated, driven by Eskom’s April 2025 electricity tariff increase of 12.74% (the latest in a series of above-inflation increases). For businesses, the financial case for solar became stronger even as load-shedding receded.
What South Africans Are Installing: System Types and Battery Statistics
One of the most striking features of South Africa’s solar boom is not the panels themselves — it is the extraordinary battery storage adoption rate. South Africa is globally unusual in the proportion of solar installations that include battery storage.
In most solar markets globally, battery storage penetration in residential installations sits at 30–60%. South Africa’s 90–95% rate is extraordinary — a direct product of the load-shedding context. When the primary use case for your solar system is maintaining power during grid outages, battery storage is not an optional upgrade: it is the entire point. This has created South Africa as a globally significant battery storage market, with implications for grid stability, demand shaping, and future energy policy.
| System Type | Typical Size | Approx. Cost (2025) | Best For |
|---|---|---|---|
| Basic backup (no solar) | 3–5 kWh battery | R20k – R45k | Essential appliances (lights, WiFi, phone charging) during outages. No solar generation. |
| Entry residential solar + battery | 3 kWp panels + 5 kWh | R60k – R90k | Apartment or small home. Powers essential loads during day and stores for evening. |
| Mid-range hybrid ⭐ Most common | 5–8 kWp + 10–15 kWh | R100k – R160k | Typical 3-bed family home. Powers most loads including fridge, TV, lighting, and phone charging through extended outages. |
| Full home solar | 10–15 kWp + 20–30 kWh | R200k – R320k+ | Large homes. Near-complete grid independence including pool pumps, geysers, ovens, and AC. |
| Commercial / C&I | 50 kWp – 5 MW+ | R1M – R50M+ | Shopping centres, offices, factories, warehouses. Largest growth sector in 2025. |
System costs are indicative for 2025 South African retail installation including panels, inverter, battery, and labour. Prices have fallen approximately 30–40% since 2022 as panel costs dropped globally.
The 2023 Solar Tax Rebate — and Its Legacy
In February 2023, the South African government announced a residential solar tax rebate in the National Budget — a programme allowing homeowners to claim back 25% of the cost of new solar panels (panels only, not batteries or installation) against their personal income tax, up to a maximum of R15,000. The rebate ran from 1 March 2023 to 29 February 2024.
Its impact on the adoption trajectory was significant. The combination of sustained Stage 6 load-shedding and a meaningful government subsidy created the conditions for 2023’s record 2.6 GW deployment. Tax practitioners estimated that SARS processed hundreds of thousands of solar rebate claims during the 2023/24 tax season.
Key Solar Policy Milestones in South Africa
January 2016
SARS introduces Section 12B accelerated depreciation for commercial solar (<1 MWp in one year). First direct solar tax incentive.
August 2022
Eskom publishes first private solar capacity estimates: 2,264 MW. The baseline for all subsequent tracking.
March 2023 — Solar rebate launched
25% rebate on solar panel costs (max R15,000). Catalysed residential adoption during the Stage 6 period.
15 May 2024 — Last load-shedding event
As of September 2025, South Africa had experienced only 26 hours of load-shedding between April and September 2025. Residential solar demand moderates sharply.
April 2025
Eskom tariff increases 12.74%. C&I adoption accelerates as electricity cost management becomes the primary solar driver.
November 2025 — New Integrated Resource Plan (IRP)
First IRP with zero new coal. Targets 28.7 GW of new solar by 2039. South Africa’s solar market formally embedded in long-term policy. REIPPPP solar procurement reaches record 3.94 GW across 18 IPPs.
Solar and Property Value: What the Data Tells Homeowners
For South African homeowners, the solar question has increasingly become a property question. A home with a solar system and battery backup commands a premium at resale — and increasingly, buyers in Gauteng and Western Cape factor solar into their purchase decision.
Resale premium: R80k–R200k+
Property valuers and estate agents report that a properly installed solar + battery system typically adds R80,000–R200,000 to a property’s resale value, depending on system size, quality, and local market. Buyers are now specifically requesting solar as a feature.
Electricity bill reduction: 60–80%
A well-sized mid-range residential system (5–8 kWp) can reduce a household’s monthly Eskom bill by 60–80%, depending on usage patterns. After Eskom’s April 2025 12.74% tariff increase, the payback period on a R120,000 system is now typically 5–7 years.
Payback period: 5–8 years
With Eskom tariffs rising above inflation year after year, the financial case for residential solar grows stronger each year. Panel costs have dropped 30–40% since 2022 while electricity prices have risen — compressing the payback period significantly from the 10–12 years cited in 2019.
Installation quality warning
The 2023 residential boom brought some unqualified installers into the market. The SAPVIA GreenCard programme is the industry’s installer accreditation system — buyers and homeowners should verify their installer holds a current GreenCard before signing any contract.
Frequently Asked Questions
How many South African homes have solar panels?
Based on NTCSA data from September 2025, total private solar capacity stands at 7,300 MW. Energy analysts broadly estimate that over 1 million residential installations have occurred, contributing approximately 1.5 GW of this total — with the balance driven by commercial and industrial properties. The NTCSA data cannot distinguish between residential and C&I installations, so the exact residential figure requires SAPVIA GreenCard registration data for precision.
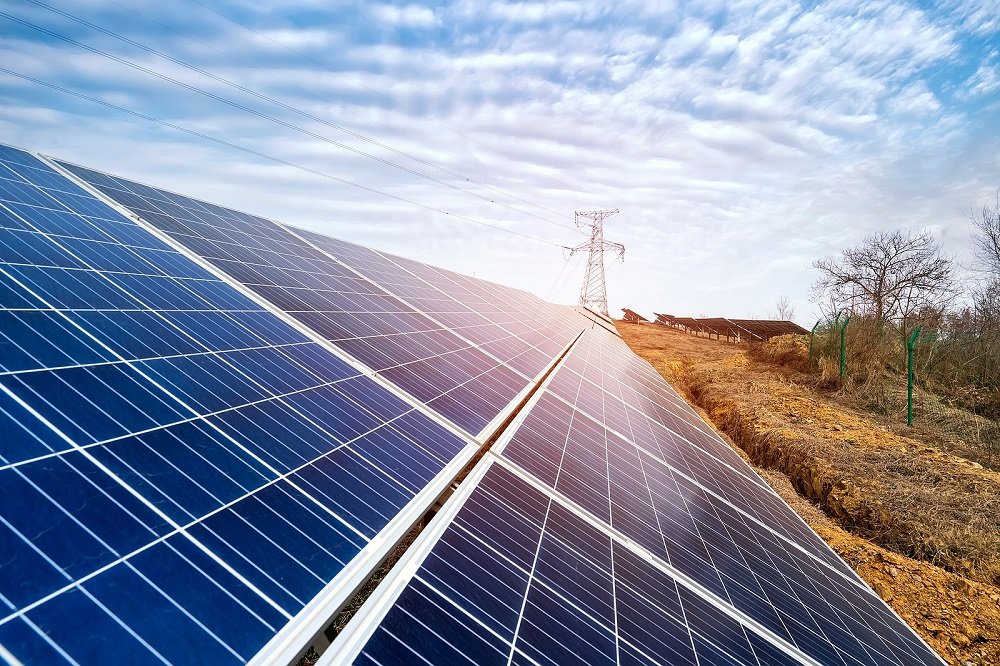
What is South Africa’s total installed solar capacity in 2025?
South Africa’s total cumulative solar capacity across all segments exceeded 10 GW in 2025, according to SAPVIA. This includes utility-scale solar (REIPPPP projects), commercial and industrial rooftop solar, and residential installations. Private solar alone (rooftop + ground-mounted, residential and C&I combined) reached 7,300 MW by September 2025 per NTCSA data — a 215% increase from the August 2022 baseline of 2,264 MW.
How much does a residential solar system cost in South Africa in 2025?
A typical mid-range residential solar system (5–8 kWp panels with 10–15 kWh battery) costs approximately R100,000–R160,000 installed in 2025. Entry-level systems with smaller panels and batteries begin around R60,000. Full-home systems with 15+ kWp and 20+ kWh battery storage can cost R250,000–R320,000+. Panel costs have dropped approximately 30–40% since 2022, while batteries (primarily lithium-iron phosphate) remain the largest cost component.
Which province has the most solar panels in South Africa?
Gauteng has the largest total installed private solar capacity, accounting for approximately 30% of South Africa’s 7,300 MW total — roughly 2,190 MW. KwaZulu-Natal holds the second position, surprising many observers by being approximately 75% larger than the Western Cape in installed capacity. The three largest provinces (Gauteng, KZN, and Western Cape) account for approximately 60% of total national private solar capacity.
Has solar adoption slowed since load-shedding ended?
Residential solar adoption dropped sharply — approximately 60–80% by volume — after load-shedding ended in May 2024. However, total solar deployment did not collapse: commercial and industrial (C&I) adoption accelerated, driven primarily by above-inflation electricity tariff increases. 2024 was “the second best year the industry has seen” per GoSolr CEO Andrew Middleton, with approximately 1.1 GW added. 2025 saw further growth to 1.6 GW added — still well below the 2023 record of 2.6 GW but above 2024.
Sources & Further Reading
- Moneyweb — Rooftop solar now at 7,300 MW, overtakes all Eskom’s IPP capacity (September 2025)
- PV Magazine — South Africa adds 1.6 GW of solar in 2025 (February 2026)
- Africa Energy Portal — South Africa Deploys 928 MW of Solar in Q1 (2025)
- Energize — Rooftop solar expected to rebound in 2025 (January 2025)
- SAPVIA — South African Photovoltaic Industry Association (official data portal)
- SAPVIA — Trends and Statistics of Solar PV Distributed Generation in South Africa (2025)
- CSIR — Utility-Scale Power Generation Statistics South Africa 2024 (March 2025)
- Wikipedia — Solar Power in South Africa (October 2025)
- Engineering News — SA’s Solar PV Market Expected to Become One of World’s Largest (March 2024)
- Beds and All — South African Bed and Bedroom Furniture Specialists
All capacity figures are drawn from NTCSA (National Transmission Company of South Africa), SAPVIA, and CSIR data as cited. The NTCSA measures private solar using the residual load method (comparing sunny vs cloudy day grid demand by province) and cannot distinguish between residential and C&I installations. Where residential vs commercial splits are discussed, they are based on SAPVIA GreenCard installer registration data and industry analyst estimates. This article is updated when new quarterly NTCSA data is published. Next update: following Q2 2026 NTCSA release.